Edges are found in the places that are the battlegrounds between buyers and sellers. Your task as a trader is to find those places and wait to see who wins and loses.
Trading edges exist because of divergences in market perceptions and realities that result from cognitive biases because simply Market players are not rational.
Biases provide trading opportunities in a theoretical sense.

Support and resistance results from market behavior, which in turn is caused by three cognitive biases: anchoring, recency bias, and the disposition effect.
Anchoring -the tendency to base price perceptions on readily available information.
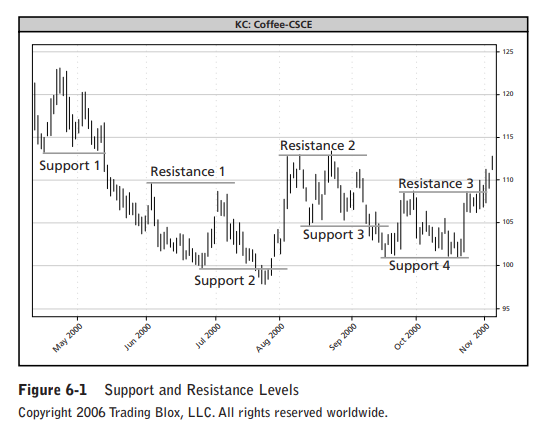
In Figure 6-1, under the label “Support 1,” a low price of about $1.13 becomes a new anchor shortly after that price is made and certainly after the price climbs to $1.20 over the next several days. It is the low point on the chart that will stand out for short-term day traders and longer-term position traders alike. As the price descends back to the range of $1.15, over the days after the high at about $1.23, traders continue to think in terms of the previous but still
recent $1.13 low. At $1.15 they will judge the price as low but not too low on the basis of a comparison with that anchor price at $1.13.
Dispositional Effect- the tendency for traders to want to lock in profits rather than let winning trades get larger.
The source of the edge for trend followers is the gap in human perception at the time when support and resistance breaks down. At those times, people hold on to previous beliefs for too long and the market does not move quickly enough to reflect the new reality.
That is why there is a statistically significant tendency for the markets to move further when support and resistance breaks down than at other times.
In the case above, there are no new buyers at the prices below the initial resistance at the end of the “Support 1” line. If you wanted to buy heating oil and the price was dropping below $2.05, why would you buy there? You wouldn’t; you would wait until the price had stopped dropping. Why buy now if the price is dropping? Yet as the price continues to drop, even more people who need to sell will panic, sending the price lower and lower. This will continue until the selling exhausts itself and some of those who wish to buy start to believe that the price will not drop further.
The Turtles saw this happen time and time again. Sometimes we were initiating positions, and during those times we were happy with the subsequent price movements. Sometimes we were exiting positions, and at those times we were among those trying to exit our profitable positions as we saw the support break down.
Shaky Ground
The prices near the edges of support and resistance represent what I call points of price instability. They represent places where prices are unlikely to remain but are more likely to move higher or lower.
That is why I use the word unstable to describe those points. There is too much pressure at
those points. One side or the other will win the battle of psychological warfare, and as the exhausted side gives up, the price will move up or down. It generally will not stay where it was. Points of price instability represent good trading opportunities.
It is easiest to tell who will win a battle when it is nearly over. It is also easiest to tell whether the buyer or seller will win the psychological battle of support and resistance after they’ve engaged
and you can see the price either continuing to break out through that support or resistance or clearly bouncing off of it.