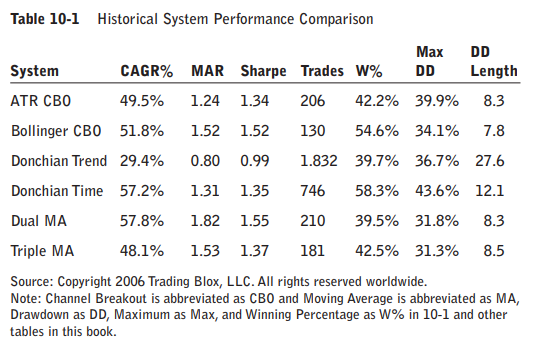
I tested all six systems with the same test data—money management, portfolio, and test start and stop dates—using our trading simulation software, Trading Blox Builder. The software ran a simulation for each of the systems from January 1996 through June 2006.

The notable surprise in Table 10-1 is the performance of the Dual Moving Average system, which demonstrated better performance than did its more complex counterpart the Triple Moving Average System. This is just one example of many that suggest that the fact that a system is complex does not necessarily make it better.
All of these are basic systems. Three of them—the Dual Moving Average system, the Triple Moving Average system, and the Donchian Trend with time-based exit system—do not even have any stops. This means that they violate one of the most cherished maxims of
trading—“Always have a stop loss”—yet their risk-adjusted performance is as good as or better than that of the other systems.
Adding Stops
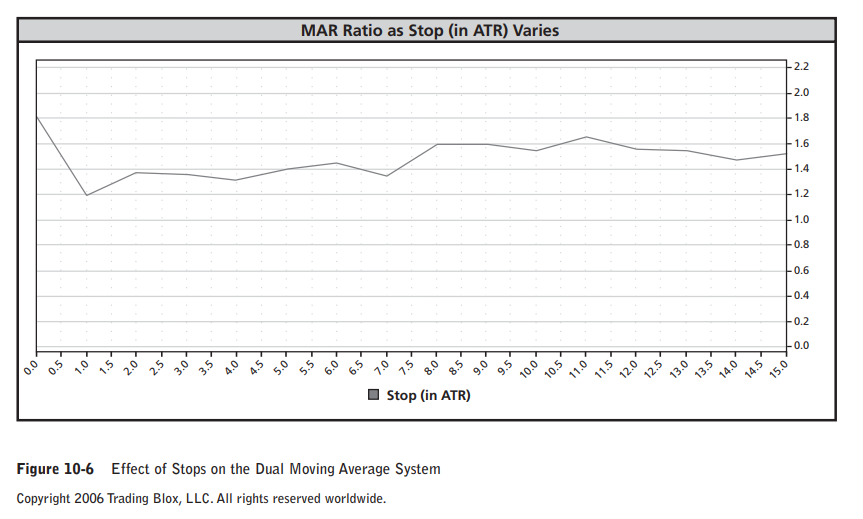
Many traders are uncomfortable with the idea of having absolutely no stops. I prefer to try out an idea and benefit from the confidence that comes from having concrete answers. Figure 10-6 demonstrates the effect of using a stop at various widths in ATR from the point of
entry.
Note that the zero case, which means no stop at all, has the best MAR ratio numbers. In fact, the test with no stops is better for all the metrics: CAGR%, MAR ratio, Sharpe ratio, drawdown, and length of drawdown—every single metric. The same test of stops applied to the Donchian Trend with time-based exit system yields similar results except that for very large stops of 10 ATR or more, the results are about the same as those for a test with no stops.
This certainly goes against the common belief that one must always have a stop. Why is this? Weren’t we taught that stops are very important for preserving capital? How come the drawdowns do not go down when we add stops?

Many traders believe that what they need to worry about is the risk of a series of losing trades. Although this may be true for short-term traders who have trades that last for a few days, it is not true for trend followers. For trend followers, drawdowns also come from trend reversals, usually after major trends. Sometimes the trend reversals are followed by very volatile markets in which it can be extremely difficult to trade.
We Turtles knew that giving up part of the profits we had accumulated during a trend is a normal part of trading as a trend follower. We knew that we would experience large drawdowns. Nevertheless, this was really painful for some of the Turtles, especially the ones who were the most affected by losing money. Watching profits vanish after they have just been earned is the hardest part of our style of trading.
Systems Tested Again
Recall that the systems were tested through the end of June 2006, and as I write this, many more months have passed. You may be curious about what happened to our systems in the interim.
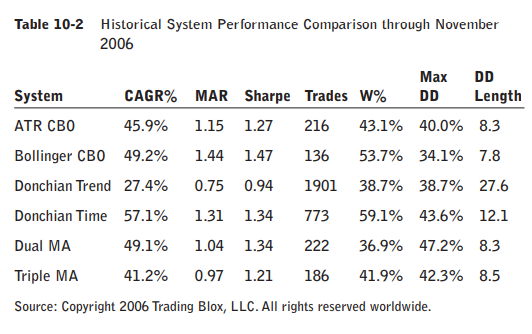
I changed the end date for the tests, using data through the end of November 2006, and Table 10-2 shows the updated results.
Table 10-1


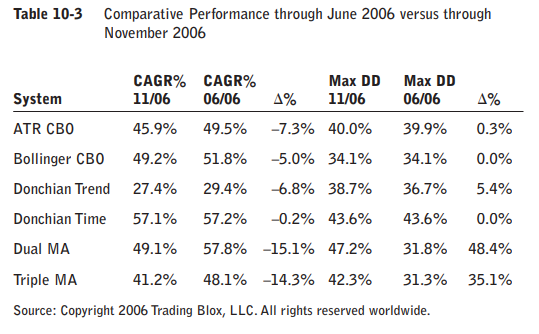
A quick glance at the CAGR% and MAR ratio tells you fairly quickly that the last few months of 2006 were bad for trend-following systems in general. The interesting aspect here is the
changes that occurred. Table 10-3 reveals the percentage changes in CAGR% and maximum drawdown,

How did our results change so dramatically? Why did our best system have a 50 percent increase in the size of the drawdown? Why did the system that used the simplest exit have
no change in performance over the last five months when some other systems did especially poorly? How does a trader build systems that are more likely to perform to expectations? Put a different way, how can you confirm your expectations to better fit the probable outcomes of trading a system?