Turtle Style

<Turtle Tools>

  • Limit Order/ No Market Order
  • Manage Money
  • Probability
  • N, Average True Range

For example, if you want to buy gold and the price is currently at 540 and has been moving between 538 and 542 for the last 10 minutes, you might put in an order to buy at “539 limit” or “539 or better.” Over time, even small differences in price add up to a lot of money.

<The Turtles used two approaches to money management>

First, we put our positions in small chunks. That way, in the event of losing trade we would have a loss on only a portion of a position.

Second, we used an innovative method they devised for determining the position size for each market. The method is based on the daily movement of the market either upward or downward in constant dollar terms. They determined the number of contracts in each market that would cause them all to move up and down by approximately the same dollar amount. Rich and Bill called the volatility measure N, although it now is known more commonly as average true range. That is the name given to it by J. Welles Wilder in his book New Concepts in Technical Trading Systems.

This makes it very easy to keep a trade for a long time because the market does not give back profits during the trade. Volatile markets are much more punishing for trend followers. It can be very difficult to hold onto a trade when profits are vanishing for days or weeks at a time.

Turtles were taught how to think in terms of the long run when trading and we were given a system with an edge. Trading methods that work over the long run have what is known in gambling as an edge.

Remember outcome bias: the tendency to judge a decision on the basis of its outcome rather than on the quality of that decision at the time it was made? We were trained explicitly to avoid outcome bias, to ignore the individual outcomes of particular trades and focus on expectation instead.

Casino owners do not care about the losses they incur because such losses only encourage their gambling clientele. For owners, losses are just the cost of doing business; they know they will come out ahead over the long run.

<The Turtle Mind>

• Think in terms of the long run when trading.
• Avoid outcome bias.
• Believe in the effects of trading with positive expectation.

The Turtle Way views losses in the same manner: They are the cost of doing business rather than an indication of a trading error or a bad decision. To approach losses in this way, we had to know that the method by which the losses were incurred would pay out over the long run. The Turtles believed in the long-term success of trading with positive expectation.

Rich and Bill might say that a particular system had an expectation of 0.2; that meant that over time you would make 20¢ for every dollar risked on a particular trade.

We had full discretion over our accounts and could make any trades we wanted as long as we stated the reasons behind a trade and followed the general outlines of our system. We did this by maintaining a log for the first month that indicated the reasons behind every trade we made. Most of my entries were of the following form: “Entered long at $400.00 because it was a 60-day breakout according to the rules of System 2.”

Since the charts were updated only once per week, we needed to pencil in the prices for new days after the close each day.

“We were told over and over not to miss a trend” and here it was only a few weeks later and many of the Turtles had missed the boat on a very significant one.

According to Rich and Bill’s training, it was very clear that the right thing to do during a brief drop was to hold on and let the profits run.
I also thought he would look more favorably on trades faithfully executed that incurred losses than on trades we should have taken but did not, even if that avoided losses.

If you were born with the right qualities, you will find it easier to learn how to trade well; if you were not, you will need to develop those qualities. That will be your primary task. What are the right qualities?

Turtles do not care about being right.

They never look at markets and say: “Gold is going up.” They look at the future as unknowable in specifics but foreseeable in character. In other words, it is impossible to know whether a market is going to go up or down or whether a trend will stop now or in two months. You do know that there will be trends and that the character of price movement will not change because human emotion and cognition will not change.

It turns out that it is much easier to make money when you are wrong most of the time. If your trades are losers most of the time, that shows that you are not trying to predict the future. For this reason, you no longer care about the outcome of any particular trade since you expect that trade to lose money. When you expect a trade to lose money, you also realize that the outcome of a particular trade does not indicate anything about your intelligence. Simply put, to win you need to free yourself and your thinking of outcome bias. It does not matter what happens with any particular trade. If you have 10 losing trades in a row and you are sticking to your plan, you are trading well; you are just having a bit of bad luck.

The ability to avoid recency bias is an important component of successful trading.

<Avoid the Future Tense>
<Thining in Probabilities>
<Dos and Don’ts for Thinking Like a Turtle>

1. Trade in the present: Do not dwell on the past or try to predict the future.The former is counterproductive, and the latter is impossible.

2. Think in terms of probabilities, not prediction: Instead of trying to be right by predicting the market, focus on methods in which the probabilities are in your favor for a successful outcome over the long run.

3. Take responsibility for your own trades: Don’t blame your mistakes and failures on others, the markets, your broker, and so forth.Take responsibility for your mistakes and learn from them.

In trading, the best edges come from the market behaviors caused by cognitive biases.

<Elements of an Edge>

To find an edge, you need to locate entry points where there is a
greater than normal probability that the market will move in a particular direction within your desired time frame.

Simply put, to maximize your edge, entry strategies should be paired with exit strategies. 

Thus, trend-following entry strategies can be paired with many different types of trend-following exit strategies, countertrend entry strategies can be paired with many different countertrend exit strategies, swing trading entries can be paired with many different
types of swing trading exit strategies, and so on. 

<Components that make up the edge for a system>

System edges come from three components:

• Portfolio selection: The algorithms that select which markets are valid for trading on any specific day.

• Entry signals: The algorithms that determine when to buy or sell to enter a trade.

• Exit signals: The algorithms that determine when to buy or
sell to exit a trade.
The Edge Ratio (E-Ratio)

It is possible for an entry signal to have an edge that is significant for the short term but not for the medium term or long term.

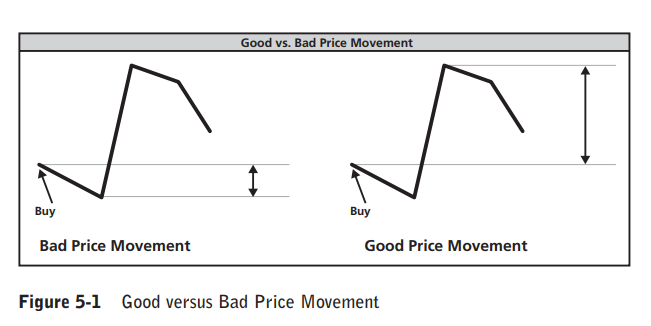
MAE– the maximum move in the bad direction as the maximum adverse excursion.

MFE– the maximum move in the good direction as the maximum favorable excursion.

Figure 5-1 demonstrates the case where the MFE (good price movement) is much higher than the MAE (bad price movement). You can use these to measure the edge of an entry signal directly.

You can use these to measure the edge of an entry signal directly. If a certain entry signal generates a move in which the average maximum good movement was higher than the average maximum bad movement (i.e., the average MFE was higher than the average
MAE), this would indicate that a positive edge existed. If the average MAE (adverse movement) was higher than the average MFE (good movement), this would indicate that a negative edge existed.

For example, take the case in which one bought if a coin landed heads up and sold if it landed tails up. One would expect that the price movement subsequent to this type of entry would have an MFE equal to its MAE.

First, you need a way to equate price movement across different markets. Second, you need a way to determine the time period over which to measure the average MFE and average MAE. To normalize the MFE and MAE across markets so that you can compare the averages meaningfully, you can use the same mechanism the Turtles used to normalize the
size of our trades across markets: equating them by using the average true range (ATR).

<ATR>

To isolate the behavior of entries over various markets, it is useful to be able to compare the price behavior of an entry signal across different time frames. I usually examine a specific number of days and then measure the MFE and MAE for that number of days after each signal is generated.

The E-ratio combines all of the pieces described above by using the following formula:

1. Compute the MFE and MAE for the time frame specified.

2. Divide each of them by the ATR at entry to adjust for
volatility and normalize across markets.

3. Sum each of these values separately and divide by the total
number of signals to get the average volatility-adjusted MFE
and MAE.

4. The E-ratio is the average volatility-adjusted MFE divided
by the average volatility-adjusted MAE.

To define the time frame, we use the number of days in the description of the ratio to indicate the number of days over which the component MFE and MAE were computed.

For example, an E10- ratio measurement computes the MFE and MAE for 10 days, including the day of entry; an E50-ratio uses 50 days, and so on. The E-ratio can be used to measure whether an entry has an edge. 

For example, you can use it to test whether a completely random entry has any edge. To illustrate, I ran a test of the E-ratio for the period of the last 10 years by using an entry that randomly enters long or short at the open, depending on the computer equivalent of a coin flip.

How to calculate:

  1. Record Maximum Adverse Excursion and Maximum Favorable Excursion at each time step since signal.
  2. Normalize MAE and MFE for volatility. To compare across markets we need a common denominator. Let’s use ATR or a unit of volatility.
  3. Average all MFE and MAE values. Now you should have average MFE and average MAE at 1 bar since signal. Average MFE and average MAE at 2 bars since signal…
  4. Divide Average MFE by Average MAE at each time step.

Example. Calculate E-Ratio at one bar out from signal.

Signal 1:

MFE 1.50            ATR 1.27

MAE 1.00            ATR 1.27

Signal 2:

MFE 1.33            ATR 1.19

MAE 1.04            ATR 1.19

Signal 3:

MFE 1.83            ATR 1.67

MAE 1.27            ATR 1.67

Average MFE = ((1.50/1.27)+(1.33/1.19)+(1.83/1.67))/3 = 1.13

Average MAE = ((1.00/1.27)+(1.04/1.19)+(1.27/1.67))/3 = 0.81

E-Ratio at Bar One = 1.13/0.81 = 1.395

So in this example, one bar after our signal, we can expect ~.40 more units of volatility in our favor than against us. In other words, if ATR is 20 points then we can expect the trade to move on average 8 points (8/20 = .4) more in our favor than against us 1 bar after the signal is generated.

If the average MFE is greater than the average MAE, then the entry has a positive edge. The greater the MFE in respect with the MAE, the more pronounced and favorable the edge of your entry logic. This is the basis of what is called a Mathematical Expectancy Analysis.

The average of 30 individual tests showed an E5-ratio of 1.01, an E10-ratio of 1.005, and an E50-ratio of 0.997. These numbers are very close to the 1.0 we would expect, and if
we ran more trials, the numbers would get closer and closer to 1.0. This is the case because the price is just as likely to go against a position as it is to go in a direction favorable to a position over any reasonable time period.

You can also use the E-ratio to examine the major components of the Donchian Trend system. The two major components of the entries for this system are a Donchian channel breakout and a trend portfolio filter.

The Donchian channel breakout – rule that states that one should buy when the price exceeds the highest high of the previous 20 days and sell short when the price goes lower than the lowest low of the previous 20 days.

The trend portfolio filter-  you can initiate long trades only in markets in which the 50- day moving average is higher than the 300-day moving average and can initiate short trades only in markets in which the 50-day moving average is lower than the 300-day moving average. All the tests described below were performed by using a set of 28 high-volume U.S. futures
markets, employing data from January 1, 1996, to June 30, 2006.

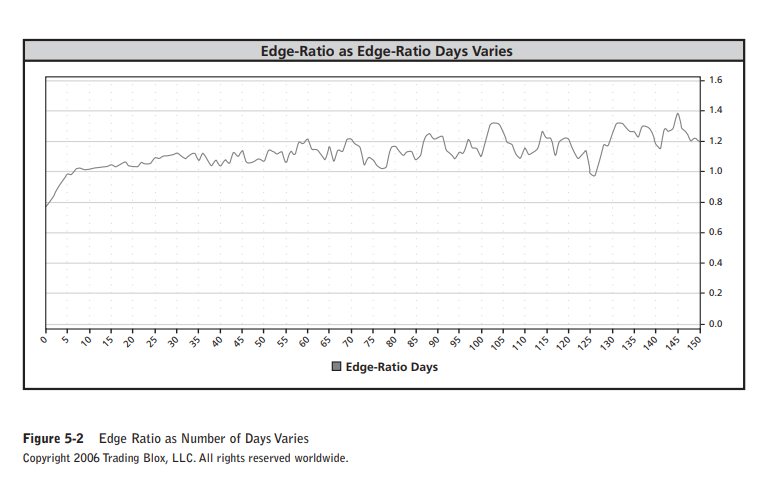
The E5-ratio for our sample is 0.99, and the E10-ratio is 1.0. “Wait a minute,” you might say. “I thought that the E-ratio would be greater than 1 when an entry had a positive edge.” This is true.

However, remember that we need to consider that the Donchian channel breakout system is a medium-term, trend-following system, so its entry needs to have an edge over the medium term, not the short term. 

The E70-ratio for our entry is 1.20, which means that trades taken in the direction of a 20-day breakout move on average 20 percent farther in the direction of the breakout than they do in the opposite direction when one looks at the price movement in the 70 days subsequent to the entry signal.

Figure 5-2 shows how the edge ratio changes for 20-day breakouts over varying numbers of days. First, the edge ratio starts off below 1.0, meaning that over the very short term there is generally more movement against a trade taken at a breakout than there is in the direction of the breakout.  This is one of the reasons trading breakouts can be very difficult psychologically. It is also one of the reasons you can make money using a countertrend trading style by betting on the breakout not holding and in favor of a bounce off of the support or resistance. There is a positive edge for these strategies in the very short term.

Second, the edge ratio begins to climb steadily but still fluctuates fairly erratically on the positive side of 1.0, indicating a positive edge but one where it is difficult to quantify with true precision.

<The Trend Portfolio Filter Edge>

How do the portfolio selection criteria affect the edge for the Donchian channel system? You can examine this in two ways.

First, you can look at how the portfolio selection filter affects the edge of purely random entries and compare them with the baseline edge ratio of 1.0 for random entries without any portfolio filtering. 

Second, you can combine the filter with our entry signals to see how the portfolio trend filter affects the edge ratio of our breakout signals.

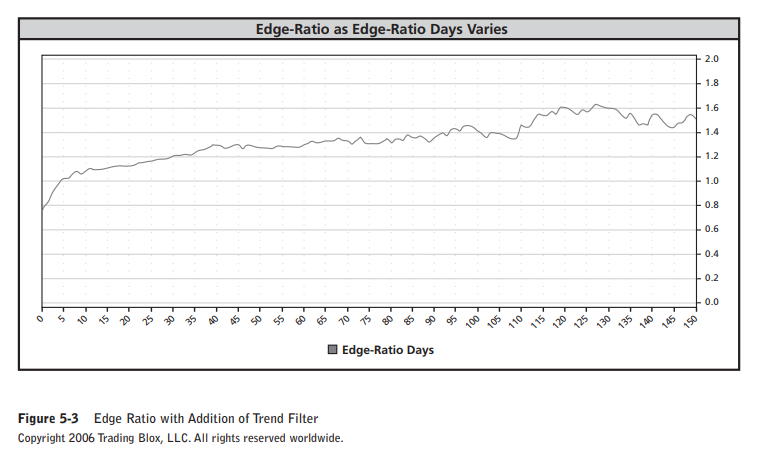
Running a test of 70,000 random entries with the trend portfolio filter shows a remarkable E70-ratio of 1.27. This is even greater than the E70-ratio for the entry signal itself. This serves as a clear indication that this portfolio selection algorithm increases the edge of the system

Using a trend portfolio filter substantially increases the likelihood of movement in the direction of a trade taken with a breakout.  The E70-ratio for our example moved from 1.20 to 1.33. Further, the use of a trend filter combined with a breakout changes the shape and smoothness of the resulting edge ratio graph (Figure 5-3). The graph shows that the E120-ratio is about 1.6. The reason for this result is that breakout trades that go against the long-term trend have been eliminated.

Those trades were a source of many of the significant moves against the initial position
since breakouts that occur in the direction opposite a trend are much less likely to result in significant continuation. These breakouts are also indicative of the market being in a state which is not as favorable to the Donchian Trend system.


<The Exit Edge>

Even the exit signals for a system should have an edge if possible. Unfortunately, it is somewhat more difficult to measure the edge of an exit. This is the case because exits are dependent on the conditions of both the entry and the exit signals. In other words, you cannot isolate an exit from the conditions that cause a position to be initiated.

Since it is a more complex system, you are less concerned with the edge of an exit than with its effect on the measurement criteria of the system itself. For this reason, it is better to measure the effect of an exit on those measurements which matter most rather
than simply by looking at what happens after the exit.


The markets include the Australian dollar, the British pound, corn, cocoa, the Canadian dollar, crude oil, cotton, the euro, the eurodollar, feeder cattle, gold, copper, heating oil, unleaded gas, the Japanese yen, coffee, cattle, hogs, the Mexican peso, natural gas, soybeans, sugar, the Swiss franc, silver, Treasury notes, Treasury bonds, and wheat.

These markets were selected from the liquid (high-tradingvolume) U.S. markets.